What I didn’t realise when I made the first plot, is that the SensorStation doesn’t actually save tag detections. Even though it displays live tag detections, it only saves live pulses. Consequently, the first plot shows an average of live pulses rather than live detections - that’s the data I physically download from the SensorStation using a USB connection.
As a “quick ‘n’ dirty” way to tackle this, I’ve taken the average signal/noise values of only the pulses that happen at least 2.5 seconds after the previous pulse. The idea is to filter out noise, without having to do any actual processing. This method gives me the following plot:
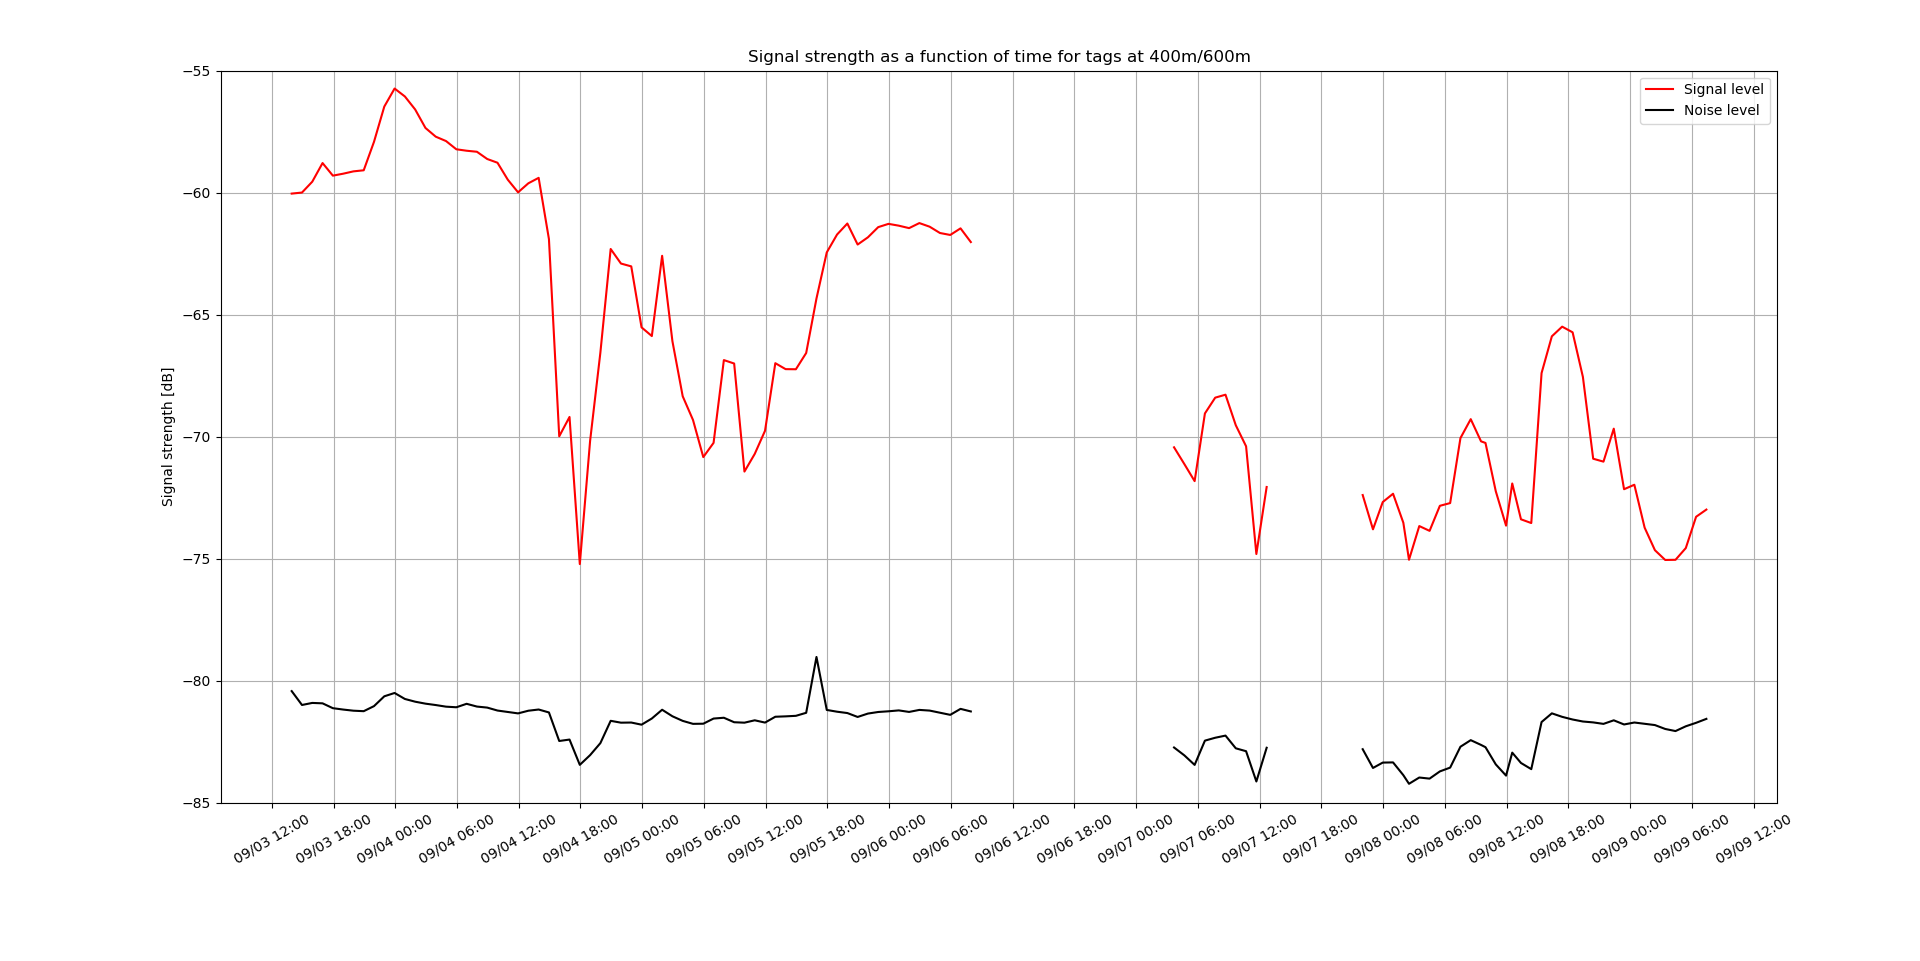
Where the first half is with the tag at 400m, and the second half with the tag at 600m. The tag-at-600m measurement is actually obscenely noisy, which is why there’s a part where the signal cuts out - it never had (at least) 2.5 seconds between any of its pulses. I’ve never seen this behaviour in action. Whenever I do “live” testing, I always see the live pulses arrive in expected intervals. I’ve never seen a constant stream of noise pulses, yet this is apparently what happened last Saturday.
The plot would probably look different with actual processing done. I’ll have to look into ways to get the R package running from Python so I can process data at will.
Edit: the increase in noise in the second part of the measurements is likely due to a tiny mismatch in burst interval causing the two tag signals to start overlapping - see also Lotek nanotag burst interval precision