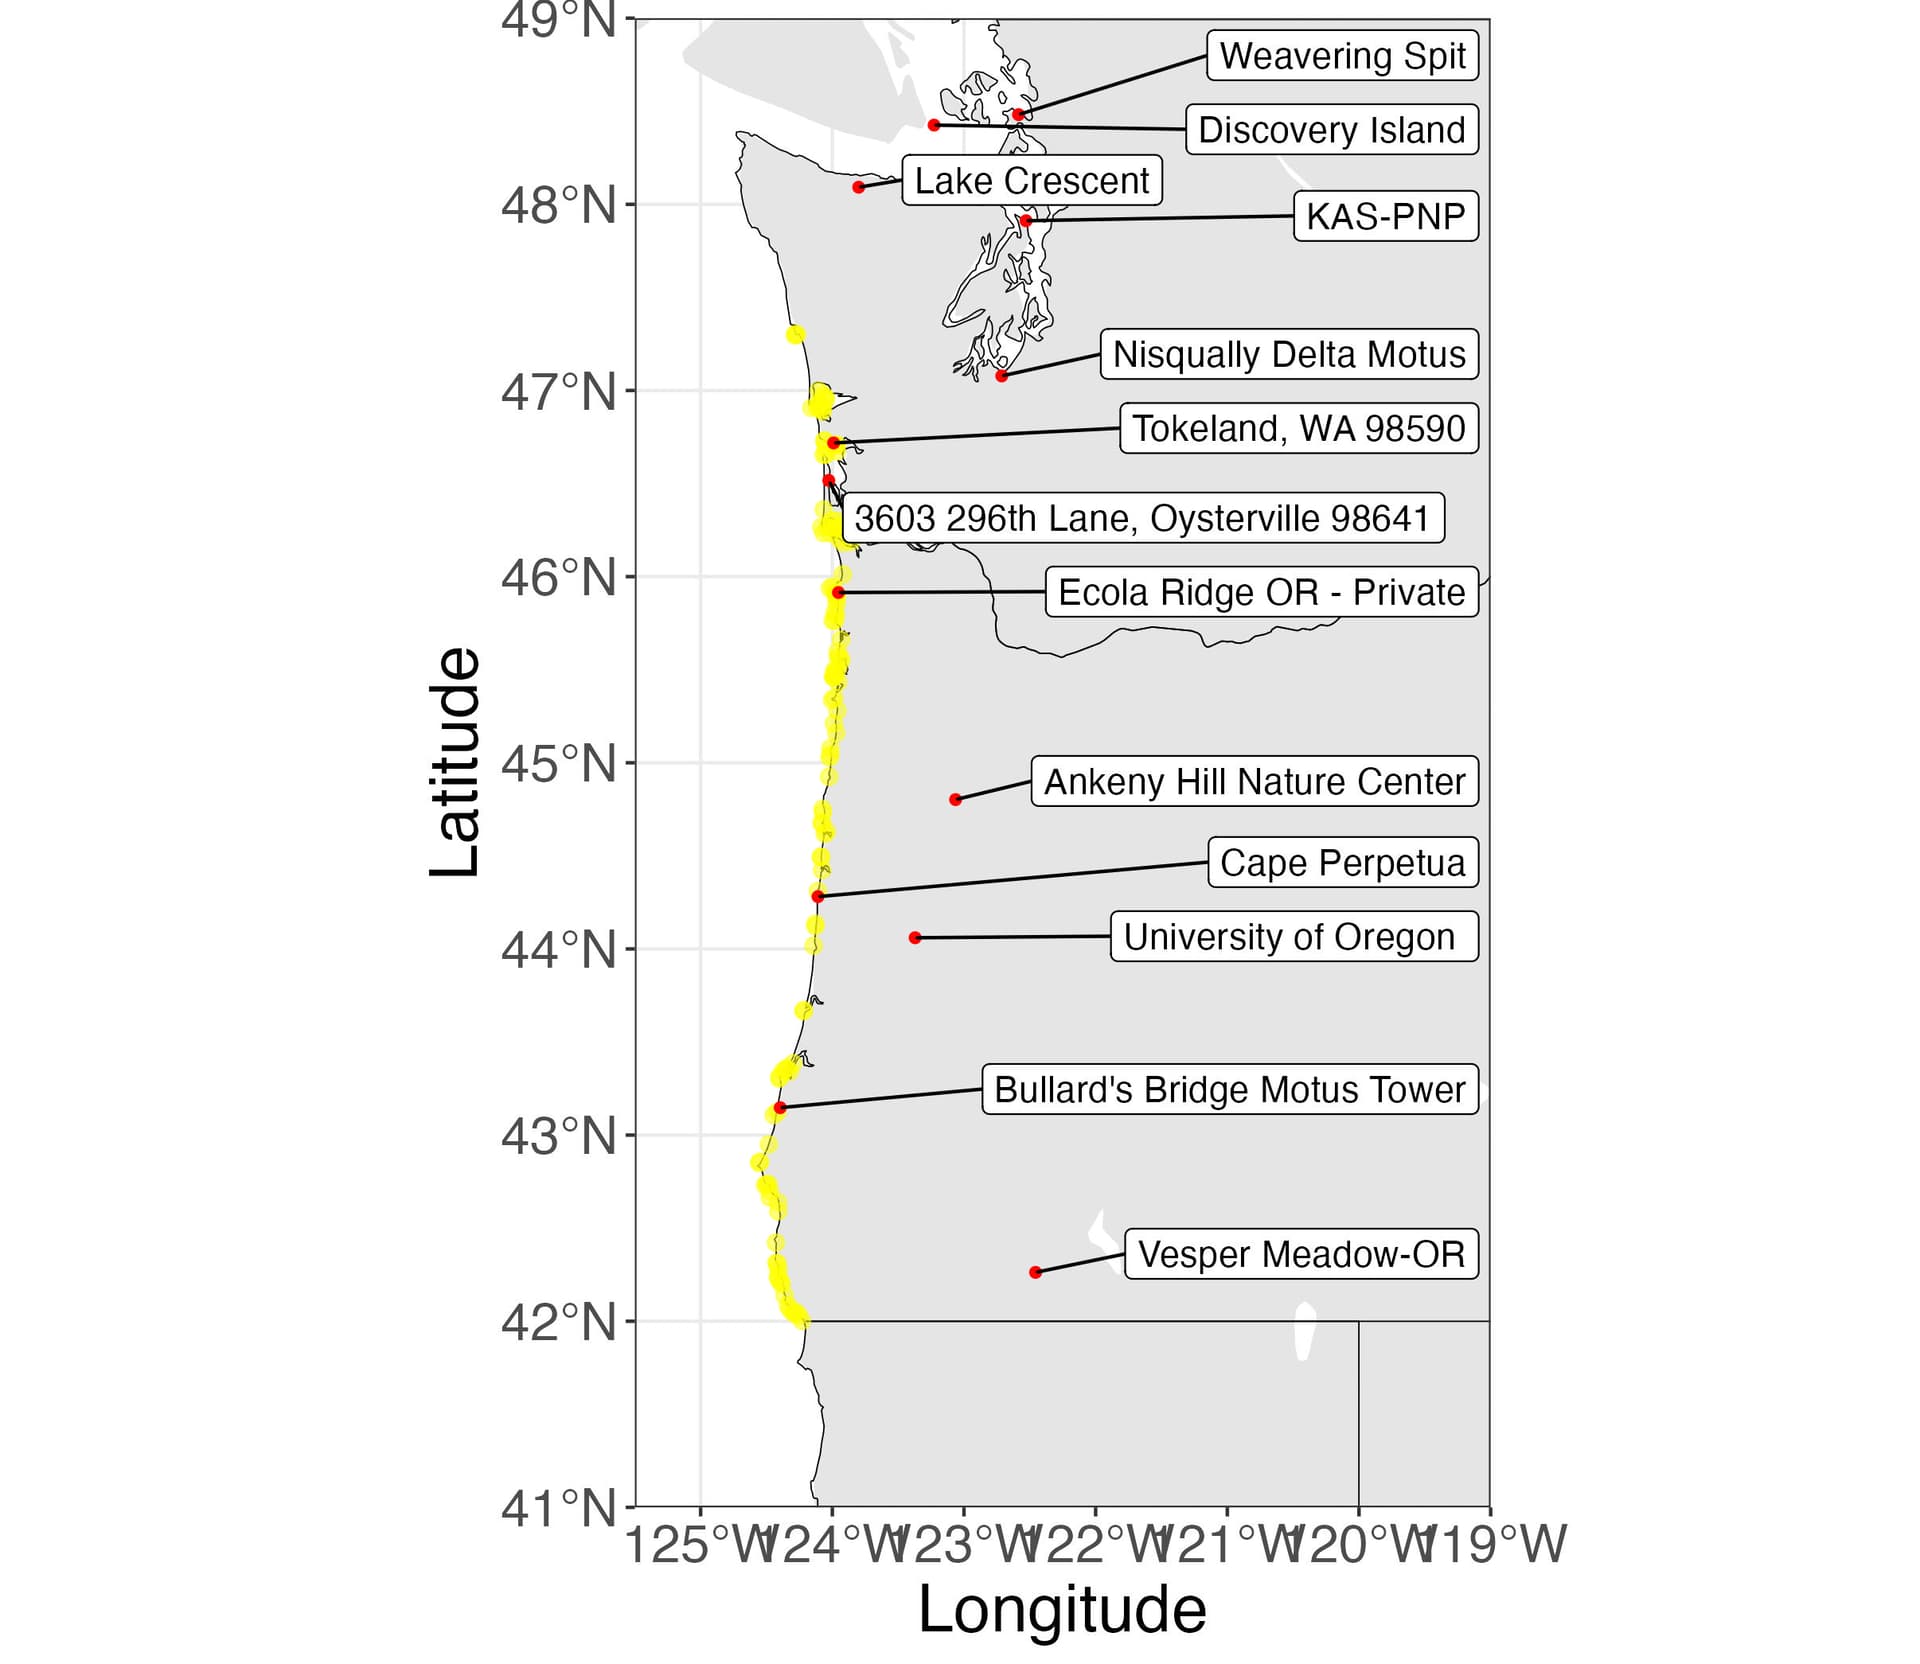
I wrote code in R using the motus package to create a map includes all Motus towers in coastal Oregon/Washington. The purpose of the map is to visually inspect the overlap between historic pelican roost sites with existing Motus towers in order to prioritize where we should survey with our CTT sidekick to detect Motus-tagged birds. However, I am finding a discrepancy between the stations that are shown on the Motus website (Explore Data) and those that are shown in R (namely, there are fewer shown in R). For example, the Cape Meares Motus (#13435) is on the Motus website as active but is indicated as terminated in R (some stations have both an active and a terminated record, such as Tokeland, WA 98590 and Weavering Spit - but I understand this situation). Other stations don’t show up at all in R (e.g., Coastal Interpretive Center (#13135), Breckenridge Bluff (#11018)).
Does anyone know what might be happening here? R map and code below used to generate the df with all receiver locations listed within the desired spatial area (and to create map).
Thanks so much!
## set the system environment (change TZ later)
Sys.setenv(TZ = "UTC")

## update tag detections

sql_motus <- tagme(468, dir = "./data/", update = TRUE)
metadata(sql_motus, 468)

# get receiver metadata
tbl_recvDeps <- tbl(sql_motus, "recvDeps")

df_recvDeps <- tbl_recvDeps %>%
  collect() %>%
  filter(longitude >= -125.5, longitude <= -122,
         latitude >= 42, latitude <= 49)

## skipping some code here to generate map baselayers
ggplot(data = world) +
  geom_sf(colour = NA) +
  geom_sf(data = lakes, colour = NA, fill = "white") +
  geom_sf(data = wa_or, fill = NA, color = "black", size = 0.4) +
  geom_sf(data = pelican_sites, color = "yellow", size = 2, alpha = 0.5) +
  theme_bw() +
  labs(x = "Longitude", y = "Latitude") +
  geom_point(data = df_recvDeps %>% filter(status == "active"),
             aes(x = longitude, y = latitude),
             shape = 16, colour = "red") +
  geom_label_repel(data = df_recvDeps %>% filter(status == "active"), aes(x = longitude, y = latitude, label = name),
                   nudge_x = 100, nudge_y = 0.1, max.iter = Inf)  +
  coord_sf(xlim = c(-125.5, -119), ylim = c(41, 49), expand = FALSE) +
  theme(text=element_text(size=20))