Hi All,
I was wondering if anyone has any documentation (or could point me in the right direction on motus.org) about what exactly a run length represents and how they are calculated?
Thanks so much!
Cheers,
Clara
Hi All,
I was wondering if anyone has any documentation (or could point me in the right direction on motus.org) about what exactly a run length represents and how they are calculated?
Thanks so much!
Cheers,
Clara
Hi Clara,
The concept of “run” represents a consecutive series of detections (hits) of a single tag on the same antenna. The run length is the number of bursts actually picked up during that series. The concept of run lengths is one of important way we have to filter out false positives, though it is not an absolute.
The Motus R book does cover some of the fundamental https://motus.org/MotusRBook, but a much more detailed explanation of the concept is also available here: https://github.com/MotusWTS/motusServer/blob/master/inst/doc/motus_data_overview.md
(i just noticed that the R book defines a run as being on the same receiver, but we’ll need to fix this for an antenna.)
If the tag goes undetected beyond a certain time, a new run ID will be created and the previous run will be interrupted. A run can allow a certain number of bursts to go undetected without breaking the run (around 20 if I recall, which I believe is probably too high). If your tag period is 5.3, you can have 2 hits spaced at 10.6 or 15.9 seconds and still be considered the correct tag. Because tag periods are based on prime numbers (5.3 is 53 / 10), multiple of tag periods should remain unique for any of the lower multiples of periods (at some point, you wouldn’t be able to differentiate 23 periods of a tag at 1.9 seconds, or 19 periods of a tag at 2.3 seconds, which is where I believe the number 20 came from: the shortest period we have is about 2.0 seconds). I have never looked into this closely, but I would expect that the ratio of the number of hits on the total duration of the run could be a useful indicator of false positives, with the run length being equal. A run of 4 hits that are consecutive is probably more reliable than a run length of 4 with lots of missed intervals between hits.
Because Lotek tag identification relies on the period between bursts, a run must have at least 2 detections (run length = 2). However, short runs are much more prone to represent false positives, especially in noisy environments where there is radio noise from other sources. Because the intervals measured are very precise and tags tend to be very stable overall, the chance that you will obtain false consecutive detections matching those intervals will diminish with time. In a quiet environment, short runs of 3-4 hits are probably mostly true detections. Much less so in a noisy environment, which is why we are providing general recommendations to increase your minimum run length, along with the activity table from which you can infer problematic periods.
Generally speaking, I think that we found that run lengths of 2 are very difficult to rely on. There are undoubtedly a portion of them that are real, but their reliability is quite low. We’ve been working on trying to better quantify that and eventually hope to provide better recommendations based on the circumstances at your receiver, but I don’t anticipate that we will have anything forthcoming soon that will help you. I would be curious though to hear from people that have filtered out data whether this ratio is somewhat correlated to perceived false positives.
Now, the concept of runs applies slightly differently in CTT tags, and I can go into a bit more details if people are interested (and we will need to document this somewhere), but the general idea would remain that longer runs would be more reliable than single detections (which we do make available for CTT), and than shorter runs.
All the best!
Denis
Denis Lepage dlepage@bsc-eoc.org
Senior Director, Data Science and Technology
Bird Canada
Denis,
Thank-you for an extremely informative post, which gives insights to some history of Motus and future directions.
The link to the docs on GitHub is extremely useful, and I must confess that I had overlooked that information when initially learning about Motus. As a suggestion is there a way to “bump” the profile of those docs somewhere on the Resources page of the website which I’m sure will help other newcomers?
Kind regards.
EAP
Ewan A. Parsons
#291 - UK Birds
Hi there,
I’ve digged a bit deeper into our own project data and maybe I could provide what Denis suggested:
This is briefly what I did: I classified our data a priori in “good” and “bad” runs. A “bad” run was if the run missed more than 3/4 of pulses OR if the average recorded time interval between the single pulses of that run deviated the specified tag burst interval more than 3 times OR if the run length was < 4. Instead, a “good” run was if the run missed less than 1/4 of pulses OR if the average recorded time interval between the single pulses of that run was smaller than the specified tag burst interval. Then I created density plots of the two categories for some variables provided in the “alltags” table, e.g. mean slop, mean burst slop, mean freqSD, etc., to see which of these variables could have some predictive power. Then I ran a simple binomial GLM over the variables I selected and predicted the probability of being “bad” for all runs based on the model outcome. We described this procedure in more detail in the supplement of Brust et al. (2019) Mov Ecol 7:32, To cross or not to cross – thrushes at the German North Sea coast adapt flight and routing to wind conditions in autumn | Movement Ecology | Full Text. It’s open access and also linked on the Motus website.
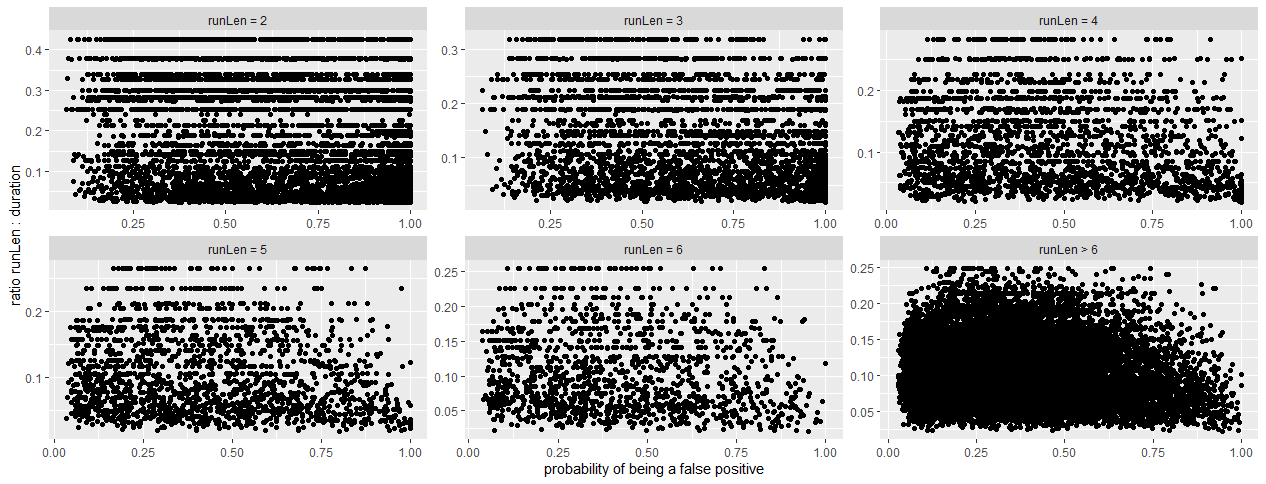
So, maybe the picture shows what Denis suggested. The three plots in the upper panel (short run lengths up to 4) show nicely that those runs that have a high probability of being “bad” often have a small ratio of run length to run duration, i.e. many pulses have been missed during the total duration of the run. The three plots in the lower panel (longer run lengths) show that also in the “good” runs the ratios are quite small which is also natural: The maximum possible ratio between run length and duration is a negative function of both, tag burst interval and run length, i.e. it decreases with increasing tag burst interval as well as with increasing run length. This is why we see in the plot with pooled runs of run lengths greater than 6 that also “good” runs can have low ratios. And this is why we decided not to use a threshold ratio for our a priori classification in “good” and “bad” but a combination of the proportion of missed pulses during the run (which helps if you have lots of short run length) and the deviation of the average time interval between the single recorded pulses of the run from the specified tag burst interval (which helps if you have lots of odd runs with longer run lengths which can occur if you have a temporary but continuous source of noise close to your receiver, e.g. a ship laying in a harbour for a few hours).
Hope this helps a bit to understand the data.
Kind regads, Bianca
Hi All,
Thanks for all of these very informative tips! Its good to know that the run times are related to a given tag burst interval. It also explains why some tags have a lot more false positives than others after filtering out any of the runs of 2 or less.
Just a clarification question: if the runs are calculated for a given antenna on a given receiver, are they calculated differently for a Lotek receiver vs a sensorgnome since the Lotek receivers rotate through the antennas and the sensorgnomes always have all antennas on at all times?
Thanks again!
Cheers,
Clara
The runs would still be calculated independently for each antenna, so you would potentially expect a higher ratio of missed detection on those receivers.
If your antennae are spliced, they are being reported as -1 for the ant number if I recall, so all detections are combined as if the antennae are all a single one. I’d have to confirm, but I expect runs are thus calculated as if this was a single antenna.
Denis
This is excellent. Exactly along the lines of what I had in mind, or was hoping the data would show.
A summary of this would be helpful to try to incorporate into the R book, especially if we can come up with some standard recommendations or some ways to determine how to classify data. Maybe I can interest you in contributing Bianca? J I’ll have to spend a bit more time examining your paper in more details.
Also, we’re looking at incorporating and refreshing some of the documentation currently a bit scattered in various places into the R book, such as the document on data processing. Stay tuned.
Denis
Hi Denis - I would be interested in more detail on how the concept of runs differs in CTT tags compared to Lotek tags. I’m new to working with CTT tags, and I have some runs in my data where the elapsed time between consecutive detected bursts is up to 120 times the burst interval of the tag. That is far higher than I’ve seen with Lotek tags, although the burst interval of the CTT tags I am looking at is also much lower (5s) than the Lotek tags I’d used (15-30s). Still, the total elapsed time between detected bursts amounts to about 10min (120*5s). I realize that this post is old now, so if this information is available elsewhere, I would appreciate being pointed in the right direction.
Thank you, Sarah
Hi Sarah. Sorry I hadn’t noticed this message from months ago! The rules on the CTT processing are a bit different. They are an absolute value (10 minutes) rather than a multiple of the tag periods. Since CTT periods are typically short (e.g. every second assuming enough power), you may have up to several hundred times the period. To clarify, 10 minutes is the longest gap a tag can be undetected on the same antenna to be part of an existing run.
Hi Everyone! I am very new to MOTUS data and am trying to wrap my head around run lengths for Lotek tags. The reason why I am curious is because I am trying to look at local activity levels of BANS, and I see there are differences in the run lengths sometimes between day and night. I guess I’m just wondering if longer run lengths could be a proxy for low activity levels? I don’t see anyone using that in the literature, only signal strength, so I wondered if I am just misunderstanding run length, or misinterpreting the data? Thanks for any insight you can offer.
Christina MacNeil cmacneil@yukonu.ca