Hi everyone,
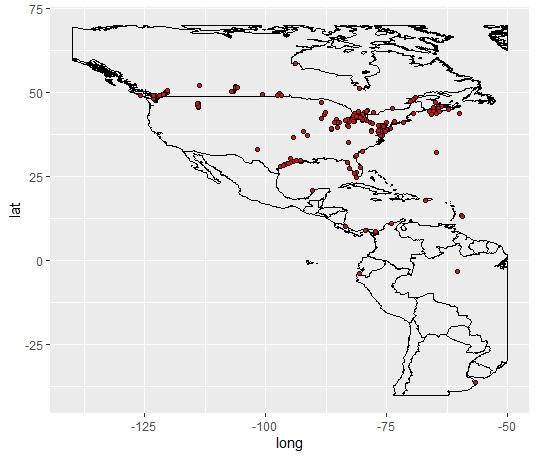
I am trying to plot all active receivers in R, but it seems like not all active receivers show up in my plot (especially recent ones seem to be missing). I am updating the data I am downloaded regularly and use code from the Motus R book (see below).
I am wondering if anyone has an idea why recent receivers (activated earlier this year) don’t show up in my plots.
Or if anyone has a suggestion how I can plot them in a different why.
Thank you very much in advance!
Hannah
Hi Hannah,
Deployments available in the ‘recvDeps’ table are only for those receivers with the same serial number as those found in your ‘alltags’ table. You can find a complete list of receiver deployments on our downloads page here:
https://motus.org/data/downloads
Regards,
Lucas Berrigan
Motus
As a matter of fact, there is a function called metadata in the motus package that allows retrieving all of the metadata for all projects.
https://github.com/MotusWTS/motus/blob/master/R/metadata.R
sql.motus ← tagme(176, new = TRUE, update = TRUE)
metadata(sql.motus)
Access different metadata tables
library(dplyr)
tbl(sql.motus, “species”)
tbl(sql.motus, “projs”)
tbl(sql.motus, “tagDeps”)
etc.
Denis Lepage dlepage@bsc-eoc.org
Senior Director, Data Science and Technology
Bird Studies Canada
PO Box 160, Port Rowan, ON N0E 1M0
519-586-3531 x155
Hi Dennis,
I have always used the code you suggest above:
sql.motus ← tagme(22, new = TRUE, update = TRUE)
metadata(sql.motus)
without issue. Starting a few months ago the metadata(sql.motus) line won’t run and I have been unable to update metadata, which has been an issue. I get a range of errors when I run that line, most often:
Error: NOT NULL constraint failed: nodeDeps.tsEnd
All my packages are updated. Any suggestions?
Sydney